SEBA Class 7 Maths Chapter 3 Data Handling Solutions (Exercises 3.1 to 3.4) | Assam Board | QR Code: M6P9Z1
Find SEBA Class 7 Maths Chapter 3 Data Handling Solutions for Exercises 3.1 to 3.4 in English Medium as per the Assam Board (SEBA) syllabus. Get step-by-step explanations to help you understand data organization, bar graphs, probability, and more. Perfect for SEBA students looking for accurate and easy-to-follow solutions.
📚 Get Complete SEBA Class 7 Maths Solutions – Access step-by-step solutions for all chapters as per the SCERT Assam syllabus.
➡ Click here for full subject solutions
Data Handling
Exercise – 3.1 |
|---|
1. Find the average and range of first 10 natural numbers.
Ans: The average of first 10 natural numbers 1, 2, 3, 4, 5, 6, 7, 8, 9, 10
∴ average 1 + 2 + 3 + 4 + 5 + 6 + 7 + 8 + 9 + 10/10
= 55/10 = 5.5
Large number = 10
Small number = 1
∴ Range = (10 – 1) = 9
2. In a district level sports competition 12 schools participated. Prizes won by each school was as follows:
11, 8, 13, 6, 10, 15, 18, 9, 10, 9, 11, 12
(i) What is the highest number of prizes won?
Ans: The highest number of prizes won = 18
(ii) What is the lowest number of prizes won?
Ans: The lowest number of prizes won = 6
(iii) What is the range of data?
Ans: The range of data = 18-6 = 12
(iv) Find the arithmetic mean of the data?
Ans: The arithmetic mean of the data 11+8+13+6+10+15+18+9+10+9+11+12/12
= 132/12 = 11
3. In an Evaluation a student obtained following marks (out of 100)
|
Mathematic-75 |
Social Science – 69 |
|---|---|
|
Assamese – 73 |
English – 67 |
|
Science – 82 |
Hindi – 78 |
Find the average of the marks obtained?
Ans: Mathematic – 75
Assamese 73
Science – 82
Social Science – 69
English – 67
Hindi – 78
Total subject = 6
Total number = 75 + 73 + 82 + 69 + 67 + 78
= 444
∴ average marks = 444/6 = 74
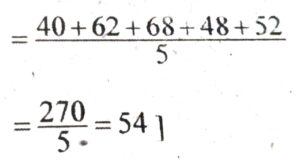
4. The number of HSLC examination passed out student of a school in last five years are 40, 62, 68, 48, 52 respectively. Find the average of the successful students.
Ans: The average of the successful students
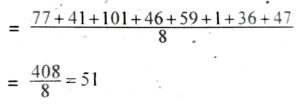
5. A cricket player scored runs in 8 innings as follows: 77, 41, 101, 46, 59, 1, 36, 47. What is the average score of the player?
Ans: The average score of the player
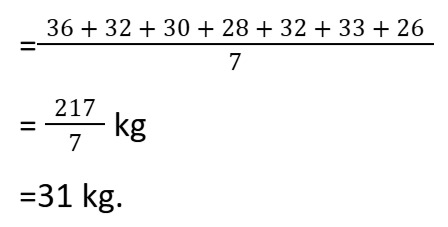
6. Weight of 7 boys are as follows 36 kg, 32 kg, 30 kg, 28 kg, 32 kg, 33 kg, 26 kg.
(i) Find the average weight of the boys?
Ans: The average weight of the boys
(ii) How many boys are there having weights more than 30 kg?
Ans: Number of boys having weight, more than 30kg = 4
(iii) Is there any boy in the table whose weight is less than 25 kg? If yes what is the number of them?
Ans: No, there is no boys having weights less than 25 kg.
7. Mira deposited Rs. 500, Rs. 600, Rs. 600, Rs. 700 and Rs. 500 in her self help group in the last 5 months. What is her average deposit per month?
Ans: Mira’s average deposit per month
![]()
৪. Students of a Primary School of different classes are as follow:
|
Class I |
Class II |
Class III |
Class IV |
Class V |
|---|---|---|---|---|
|
26 |
32 |
34 |
28 |
30 |
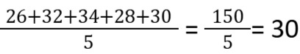
(i) What is the average number of student in the classes of the school?
Ans: The average number of students in the classes of the school =
(ii) After first Periodical Evalution 3 and 2 students were admitted to class II and V respectively. Find the new average number of student of classes of the school?
Ans: The new average number of students of classes of the school
![]()
= 31
Exercise – 3.2 |
|---|
1. Find mode from the data:
(i) 2, 2, 3, 3, 4, 4, 5, 5, 5, 6, 6, 7, 7
Ans: Mode of the data is 5, because 5 occurs the maximum number of times.
(ii) 41, 43, 41, 46, 47, 48, 41, 49, 49
Ans: Mode of the data is 41, since 41 occurs the maximum number of times.
2. Find the mode of the marks obtained (Out of 20 marks) in a test:
|
Number of students |
3 |
3 |
4 |
7 |
4 |
2 |
|---|---|---|---|---|---|---|
|
Marks obtained |
10 |
11 |
12 |
13 |
14 |
15 |
Ans: Mode of the marks is 13, since maximum marks 13 is obtained by seven students.
3. Find the mediam from the data given below:
(i) 2, 0, 1, 5, 3, 4, 6, 2, 9, 10
Ans: Arranging in ascending order we get- 0, 1, 2, 3, 4, (5), 6, 8, 9, 10, 12
Here, middle term is the median. Therefore median = 5
(ii) 9, 7, 8, 11, 12, 9, 8, 12, 10, 9
Ans: Arranging in ascending order we get- 5, 7, 8, 8, 9, (9) 10, 11, 12, 12 Here, middle term is the median Therefore, median = 9.
4. In a Mathematics test, 17 students obtained marks (out of 50) as follows:
28, 32, 35, 21, 27, 35, 27, 42, 35, 22, 23, 35, 25, 23, 40, 24, 31
Ans: Arranging in ascending order we get-
21, 22, 23, 23, 24, 25, 27, 27, 28, 31, 32, 35, 35, 35, 35, 40, 42.
Mode of the marks is 35, since maximum marks 35 occurs in the given data and here the middle term is the median. Median. is 28.
5. Find mode and median of the data given below. Are these two values same?
13, 16, 12, 14, 19, 12, 14, 13, 14
Ans: Arranging in ascending order we get-
12, 12, 13, 13, 14, 14, 14, 16, 19
Here mode is 14, Median is 14.
6. Ages (in years) of 13 students of a class are as given below:
14, 14, 15, 14, 14, 14, 15, 14, 14, 15, 15, 14, 14
Find arithmetic mean, mode and median from the data.
Ans: Arranging in ascending order we get-
14, 14, 14, 14, 14, 14, 14, 14, 14, 15, 15, 15, 15
(i) Arithmatic mean =
(ii) Mode = 14, (iii) Median = 14
7. Fill up the blanks in the table:
|
Number |
Range |
Arithmetic mean |
Mode |
Median |
|---|---|---|---|---|
|
35, 15, 0, 40, 20, 25, 45, 10, 30, 5, 15 |
? |
? |
? |
? |
Ans:
|
Number |
Range |
Arithmetic mean |
Mode |
Median |
|---|---|---|---|---|
|
0, 5, 10, 15, 15, 20, 25 35, 40, 45 |
45-045 |
240/11 = 21.82 |
15 |
20 |
8. Mention if the following statements are true or false:
(i) Mode always lies in the middle of any data.
Ans: Correct.
(ii) Arithmetic mean always lies in the middle of any daa.
Ans: Incorrect.
(iii) Median always lies in the middle of any data.
Ans: Correct.
9. Find arithmetic mean, mode and median from the data given below :
(i) 8, 8, 8, 8, 18, 18, 18, 18, 18
Ans: 8, 8, 8, 8, 18, 18, 18, 18, 18
∴ Arithmetic mean =
Mode: 18 and Median: 18
(ii) 3, 10, 10, 12, 14, 16, 16, 18, 18, 25, 28
Ans: Mean: =
Mode: 10, 16 and 18
Mediam: 16
(iii) 23, 2, 42, 6, 36, 11, 29, 9, 15
Ans: Arranging in ascending order we get
2, 6, 9, 11, 15, 23, 29, 36, 42
Mean =
No Mode and Median = 15
|
Exercise – 3.3 |
|---|
1. Answer the following question with the help of Bar graph :
(a) Numbers of students who like different games, are shown in Bar graph. Answer the following questions with the help of the Bar graph.
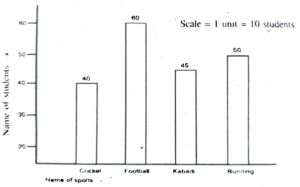
(i) How many students like football?
Ans: 60 students like football.
(ii) How many students like all the four games?
Ans: Number of students like all the four games = (40+60+45+50) = 195
(iii) What is the difference between the highest number of students who like a particular game the least number of students who like another particular game.
Ans: The highest number of students like games = 60 and least number of students like games = 40.
∴ The difference between the highest number of students who like a particular game the least number of students who like another particular game = 60-40 = 20.
(b) In a mathematics test, marks secured by students are 60, 65, 70, 75, 80 (Out of 100 marks). The marks are displayed in Bar graph as follows-
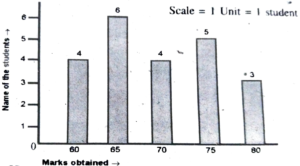
(i) How many students scored more than 70?
Ans: 4 + 5 + 3 = 12 students.
(ii) How many students scored equal marks and what is the mark?
Ans: 8 students scored equal marks and 60, 70.
(iii) How many students scored 65 and 75 marks respectively?
Ans: (6+5) = 11 students scored 65 and 75 ma respectively.।
2. The number of trainee admitted to a swimming training centre in last 5 years are as given in the table below-
|
Year |
2014 |
2015 |
2016 |
2017 |
2018 |
|---|---|---|---|---|---|
|
Number of trainee |
650 |
700 |
450 |
500 |
600 |
Using appropriate scale draw the bar graph and answer the following questions-
(i) Which year has the highest number of trainers?
(ii) What is the total number of trainees who took admission in the year 2014, 2015 and 2016?
Ans:
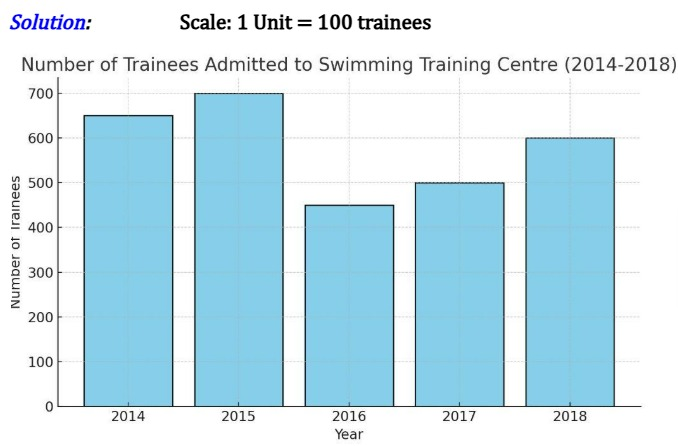
(i) The highest number of trainers trained in the year 2015.
(ii) The total number of trainees who took admission in the year 2014, 2015 and 2016 = (650+700+450) = 1800.
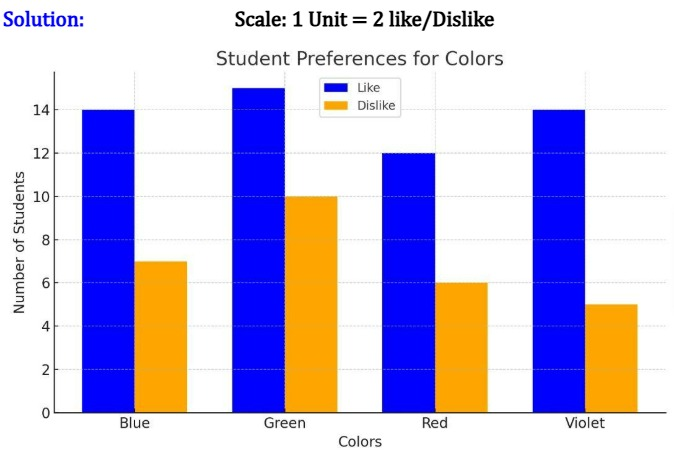
3. The students who like or dislike different colours are as given below:
|
Colours |
Blue |
Green |
Red |
Violet |
|---|---|---|---|---|
|
Students who like |
14 |
15 |
12 |
14 |
|
Students who do not like |
7 |
10 |
6 |
5 |
Using appropriate scale to draw a double bar graph.
Ans:
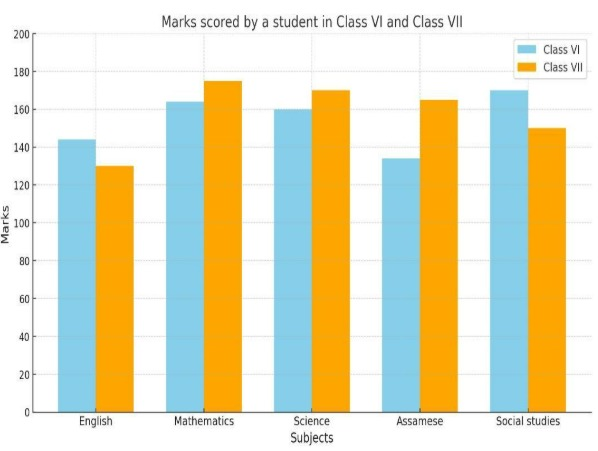
4. Marks scored by a student in all the four evaluations in Class VI and Class VII out of total marks of 200 are given in the table. Using appropriate scale draw a double Bar graph and answer the following questions.
|
Class |
English |
Mathematics |
Science |
Assamese |
Social Studies |
|---|---|---|---|---|---|
|
VI |
144 |
164 |
160 |
134 |
170 |
|
VII |
130 |
175 |
170 |
165 |
150 |
(i) In which subject has the student shown the best performance?
(ii) In which subject is the performance worst?
(iii) In which subject did the student score highest mark and in which class?
Ans:
5. The numbers of books sold by a book stall in English and Assamese during last four years are as follows. Using appropriate scale draw a double bar graph and answer the following questions.
|
Years |
2014 |
2015 |
2016 |
2017 |
|---|---|---|---|---|
|
English |
350 |
400 |
300 |
600 |
|
Assamese |
500 |
600 |
450 |
650 |
(i) In which year did the book stall sell the highest numbers of Assamese books?
(ii) What is the difference between the numbers of Assamese and English books sold in 2016?
(iii) How many books were sold in the year 2015?
Ans:
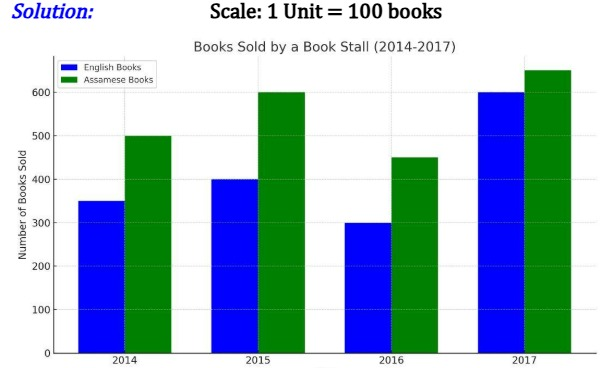
(i) The book stall sold the highest numbers of Assamese books in 2017.
(ii) The difference between the number of Assamese and English books sold in 2016 = 450-300 = 150.
(iii) 1000 books were sold in the year 2015.
|
Exercise3.4 |
|---|
1. Classify the following statements as (i) certain (ii) impossible and (iii) uncertain-
(i) Next year Independence Day will be celebrated on 15th August?
Ans: Certain.
(ii) If you do well then you will get a prize.
Ans: It may happen but it is uncertain.
(iii) In the week the day after Wednesday will be Friday.
Ans: Events are impossible.
(iv) Your friend will see you today.
Ans: It may happen but uncertain..
(v) If you visit the Zoo you will be able to see Dinosaurs.
Ans: It is impossible.
2. There are 4 marbles in a container. Out of them one is red, one is yellow, one is black and the last one is white.
(i) What is the probability of drawing the red marble?
Ans: The probability of drawing the red marble is ¼.
(ii) What is the probability of drawing the white marble?
Ans: The probability of drawing the white marble is ¼.
3. Rita, Bobita, Hema, Pushpa and Megha wrote their names on sheets of paper and put them inside a box. Megha draw a sheet of paper from the box. What is the probability of drawing her own name?
Ans: Total number of students =⅕
so, The probability of drawing her own name = 1/5
4. The letters of the word EDUCATION are written on cards and kept in a bag. What is the probability of getting a vowel from the bag?
Ans: Vowels are A, E, I, O, U – 5
∴ The probability of getting vowels from the word
‘EDUCATION’ = 5/9
5. In a basket there are 4 Mangoes, 3 Pomegranates and 5 Bananas. What is the probability of getting all the bananas from the basket?
Ans: Total number of fruits = 4+3+5 = 12
∴ The probability of getting all the bananas from the basket = 5/12
